
Winners
| Year | First Female | First Male | DFL |
|---|---|---|---|
| 2026 | - | - | - |
| 2025 | 28:33:47 - Ginny Robbins | 26:42:05 - Cameron French | 55:54:30 - PJ Jungels |
| 2024 | 36:31:04 - Andrea Purtzer | 27:05:29 - Zachary Cohen | 52:24:20 - Mario Gutierrez |
| 2023 | 27:47:37 - Ginny Robbins | 28:16:44 - Jared Campbell | 52:28:34 - Alex Bennett |
| 2022 | 28:19:59 - Ginny Robbins | 26:15:35 - Ross Ring-Jarvi | 59:18:12 - John Langford |
| 2021 | 35:44:18 - Lisa Verwys | 32:35:28 - Michael O'Brien | 48:37:12 - Jack Kurisky |
Results and splits
| Results | Splits | Map | Distance | Elevation | Finish Rate | Avg. Finish | Avg. Pace |
|---|---|---|---|---|---|---|---|
| 2026 | 2026 | 2026 | 105.8 | 24,000 | - | - | - |
| 2025 | 2025 | 2025 | 105.8 | 24,000 | 79.7% | 40:32:27 | 22:59 |
| 2024 | 2024 | 2024 | 105.8 | 24,000 | 71.4% | 41:58:29 | 23:48 |
| 2023 | 2023 | 2023 | 102.6 | 20,900 | 55.0% | 38:10:25 | 22:19 |
| 2022 | 2022 | 2022 | 102.6 | 20,900 | 88.9% | 38:08:54 | 22:19 |
| 2021 | 2021 | 2021 | 100.1 | 28,900 | 24.1% | 43:01:46 | 25:48 |
Records
Female: Ginny Robbins, 27:47:37 (2023)
Ginny Robbins of Victor, Idaho cruised to a 28:19:59 finish in 2022. Then, a year later, she took first overall and beat her own course record in an insane time of 27:47:37.
The weather was amazing from start to finish. While temperatures creeped into the high 70s on Saturday afternoon, Ginny and her fellow runners didn’t have to deal with precipitation. Nighttime temperatures were in the low 30s.
The trail was tacky and overgrown in many places. A relatively wet spring stretched the annual “green up” well into the summer, giving ground-level plants more time to grow up. There were also far more stream crossings than prior years because seasonal springs had not yet dried up.
Male: Ross Ring-Jarvi, 26:15:35 (2022)
Despite a small mishap with his pacer (who happened to be his fiancé), Ross Ring-Jarvi arrived first in 2022 with a time of 26:15:35.
2022 was another year of great weather. Runners in the middle of the pack experienced thunderstorms and cooler temperatures on Friday afternoon, but the rest of the weekend was generally clear and warm. The trail was in solid shape, too, although brush was unusually high in some places after a wet, cool spring.
“Event” record instead of “course” record
We have “event” records instead of “course” records because the former incorporates the small, year-over-year changes that most courses undergo from one year to the next. Courses change; events do not. (Credit to VHTRC for the “event record” concept.)
The 2018 Hardrock 100 Runner’s Manual captures the fluctuating nature of courses — even historic courses — nicely. The fact sheet on page 66 shows the difference in course lengths over a three-year period: 100.3 miles (2003), 101.4 miles (2004), and 100.4 miles (2005). With a five-year average finish time of 39:20:17 across all runners, that extra mile in 2004 makes a difference — a 23:21 difference!
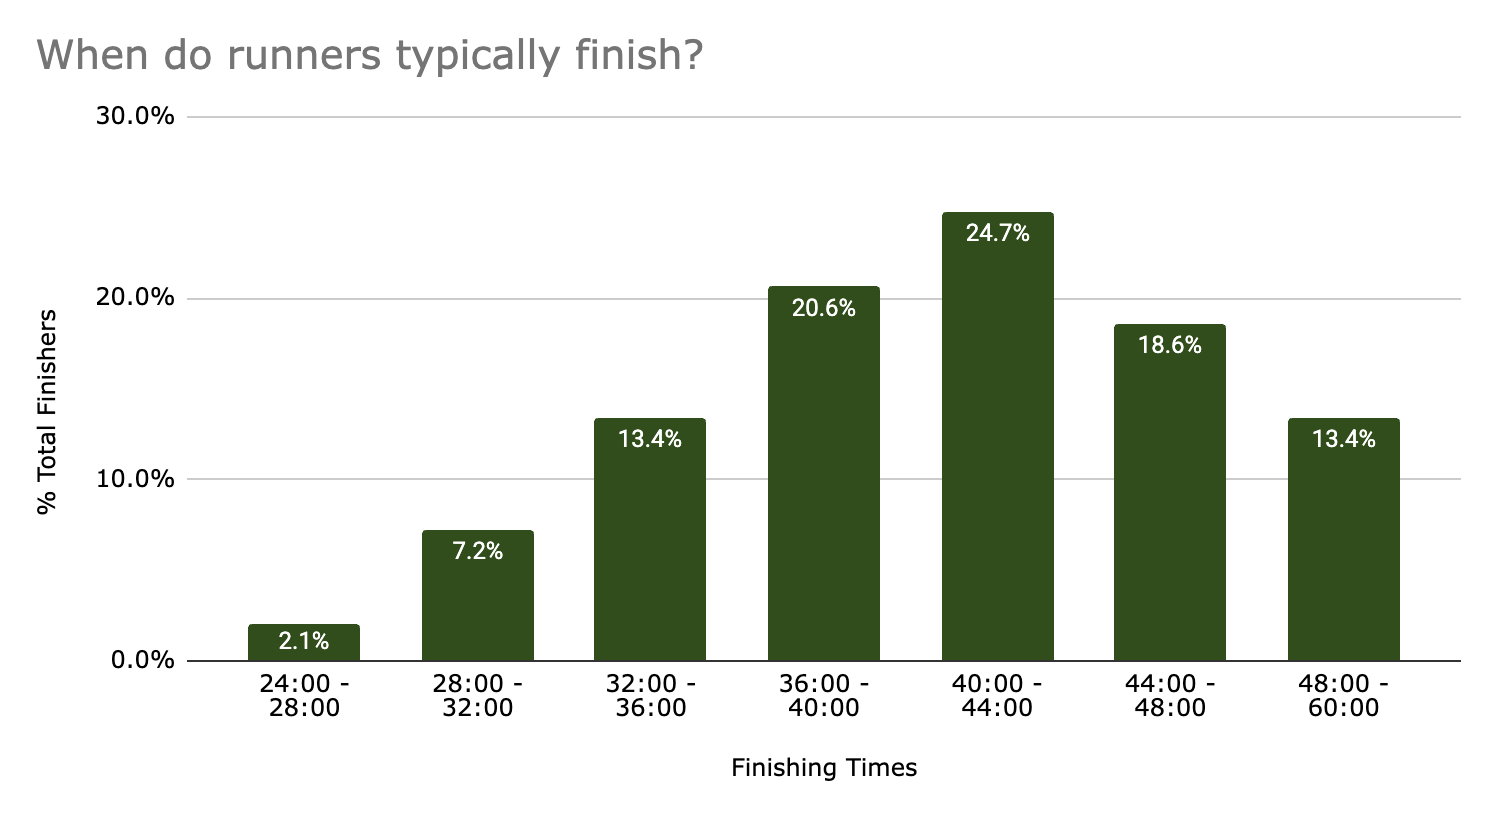
Typical finishing times
It’s the most consistent piece of feedback we get: “This race took far longer than I expected.” To put numbers aroud this, only 23% of runners have finished under 36 hours, while less than 50% have finished under 40 hours. We have (yet) to have a sub-24-hour finisher.